Competitor price checks in Excel and Python
Aug 2025 to Jan 2026
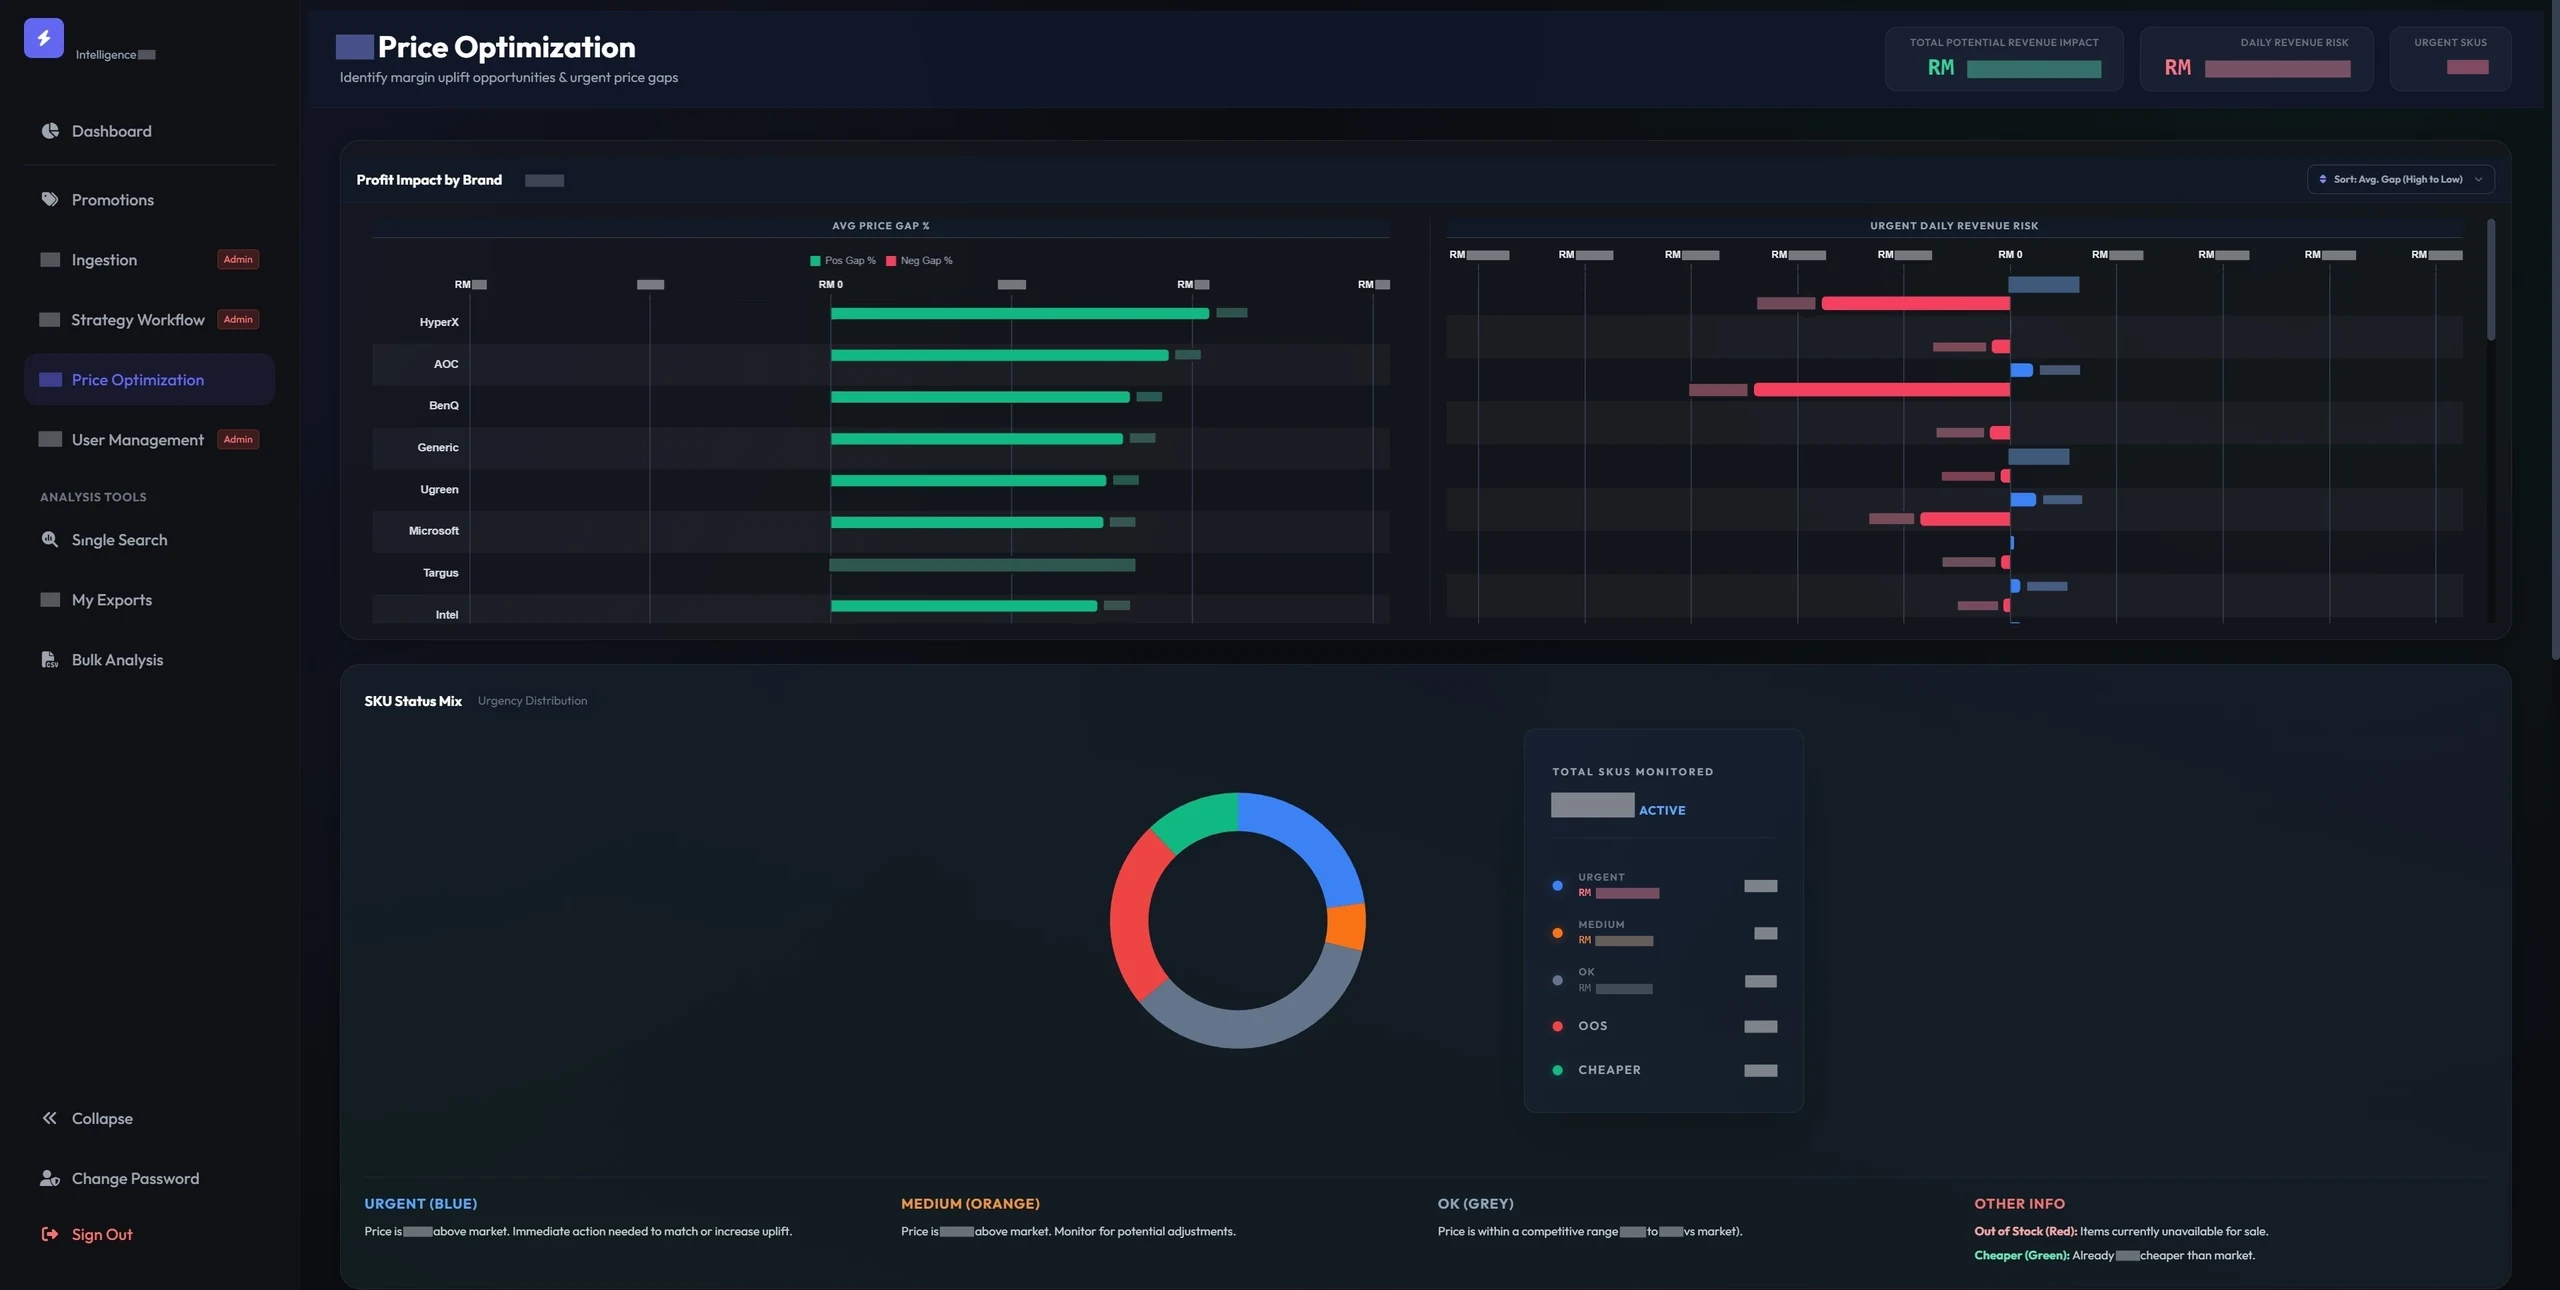
During my internship I replaced manual Shopee competitor checks with a Python collector, increasing daily coverage from about 40 to 250 products.
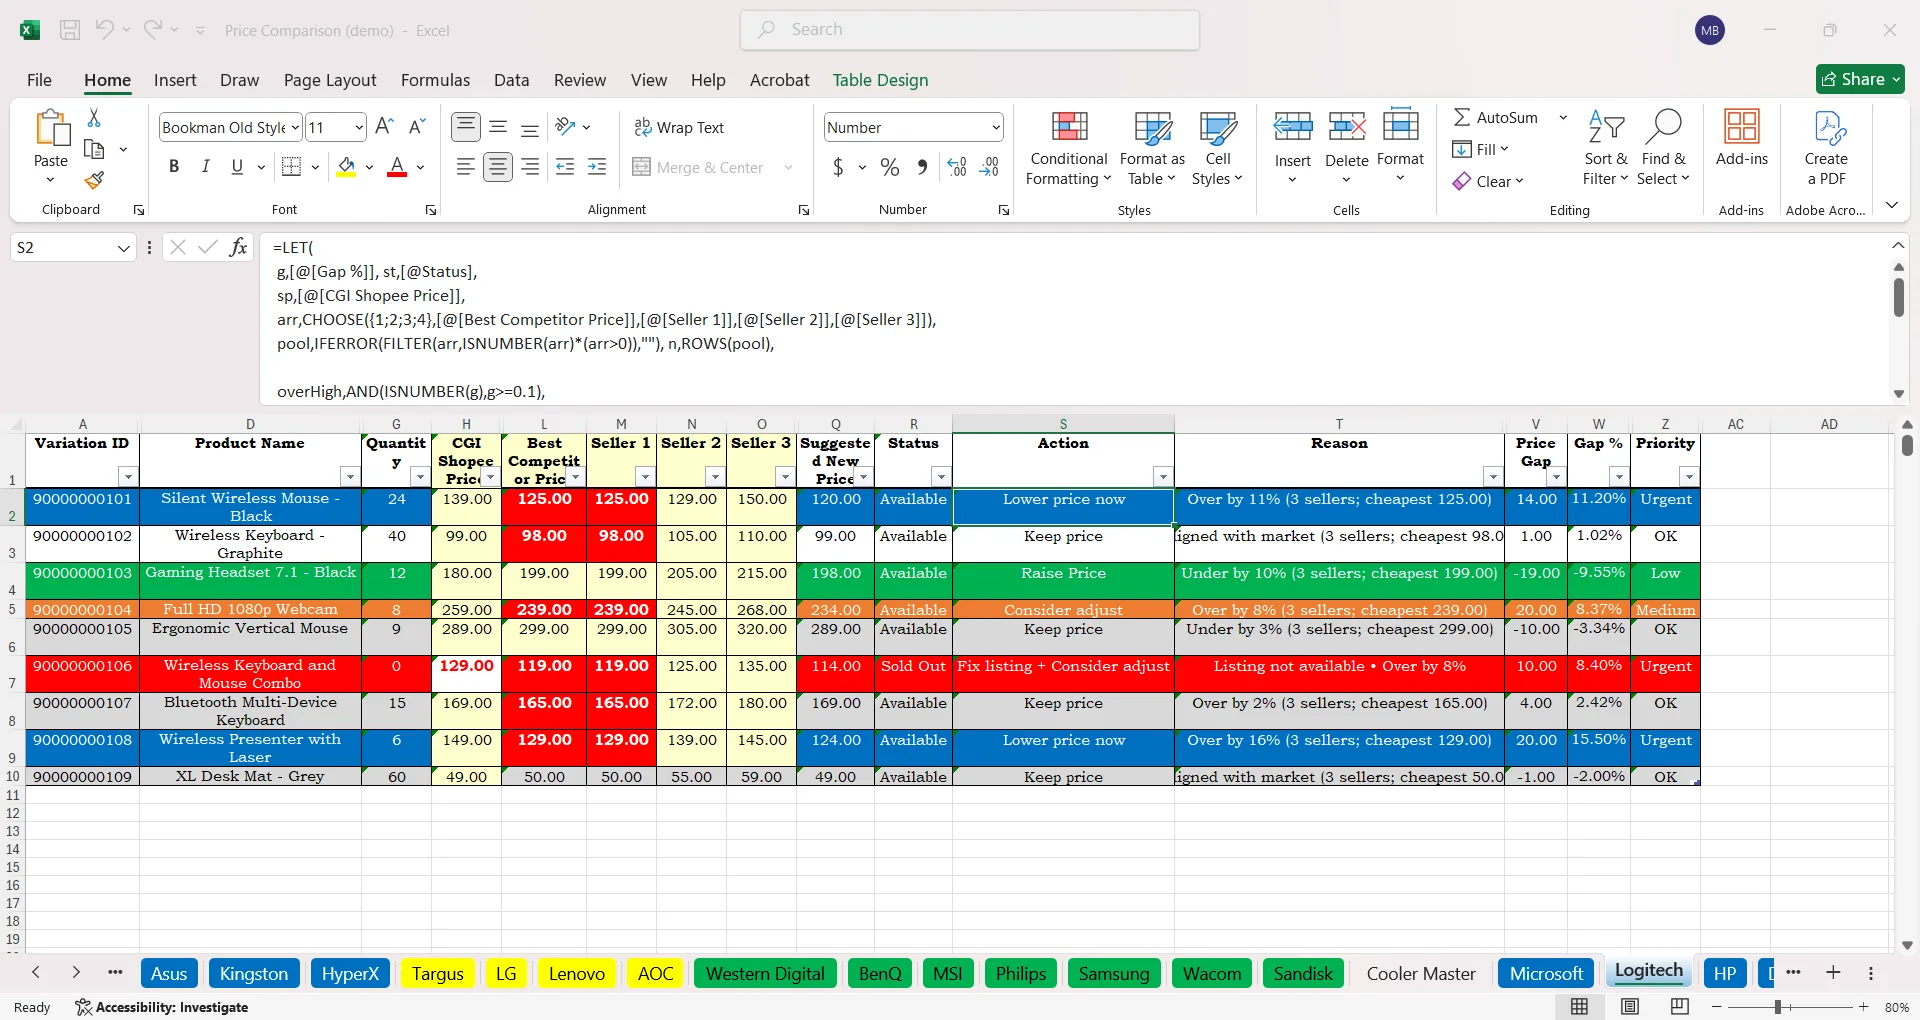
I automated an Excel workbook with one sheet for each of 28 brands. Formulas compare our price with the three cheapest sellers and suggest a price; colours flag products needing action. Macros keep the sheets consistent and place new products under the right brand.
 (opens larger view)
 (opens larger view)
 (opens larger view)
Excel (VBA, Power Query, XLOOKUP, LET, FILTER, pivot tables), Python
How it works
- XLOOKUP and LET find each product’s stock and price by variation ID, then SKU, then product name.
- FILTER and SORT pick out the three cheapest sellers. IFS and TEXTJOIN write the action and the reason.
- Power Query loads the discount and campaign exports, so each product shows whether it is on promotion.
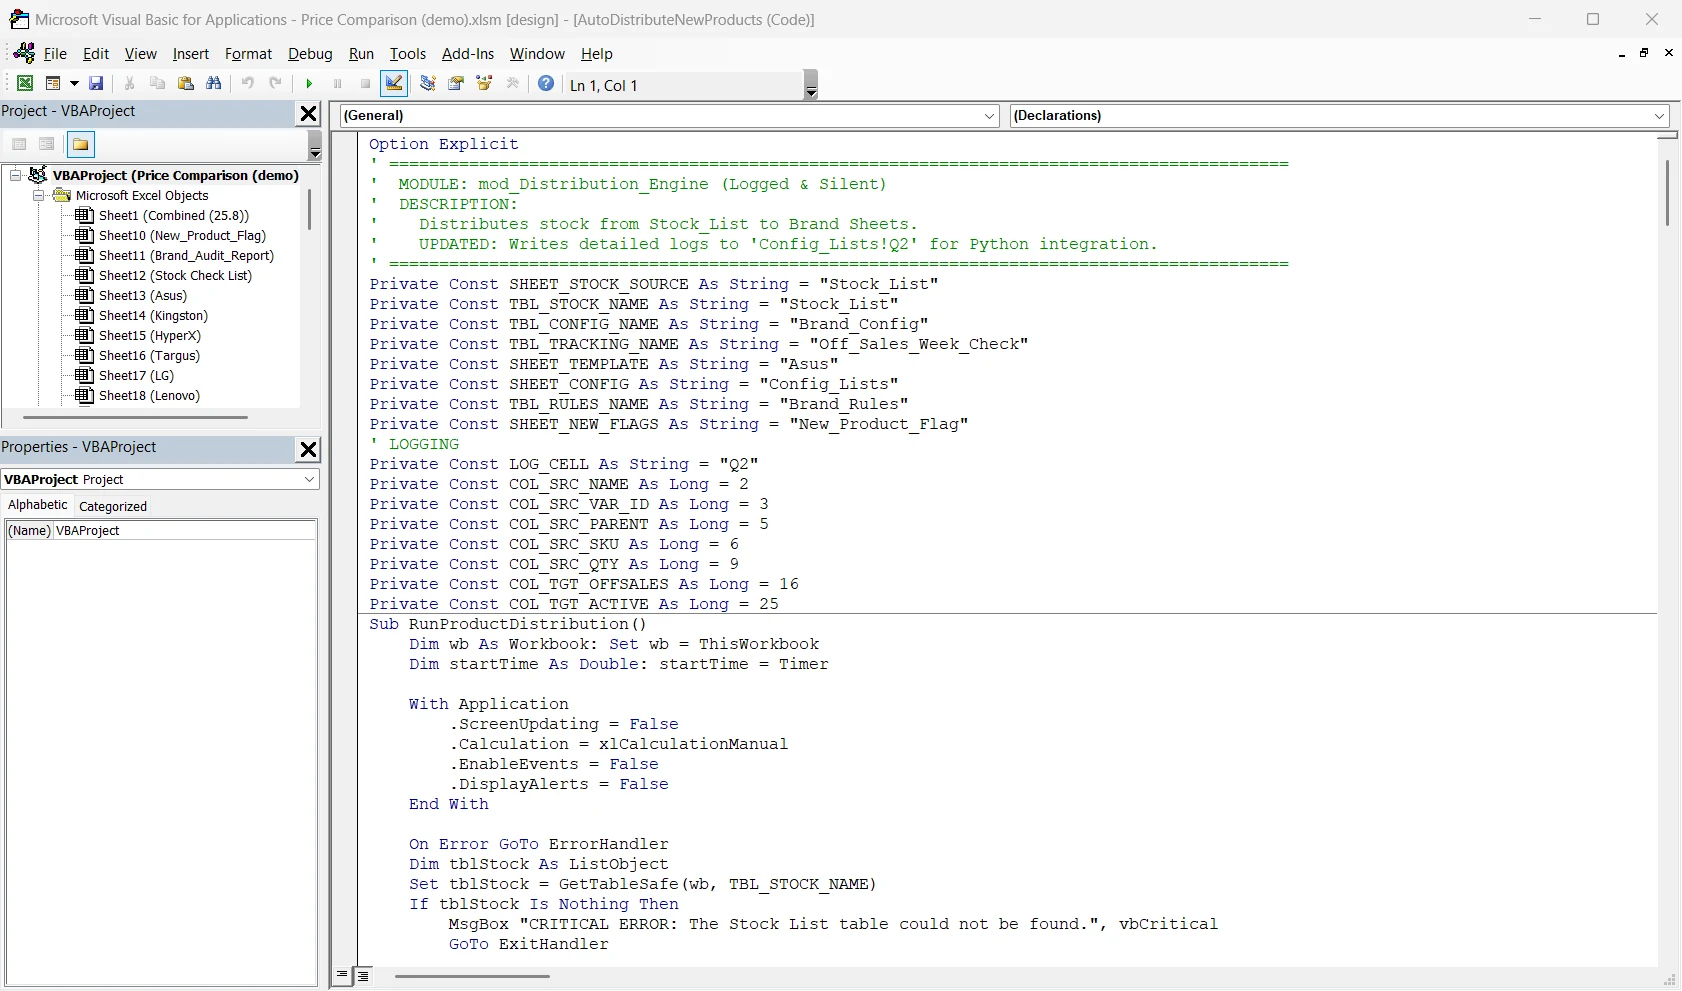
- 13 VBA modules (about 2,100 lines) merge brand sheets into one list, remove duplicates, classify new products by brand keywords and copy formulas from a master sheet.
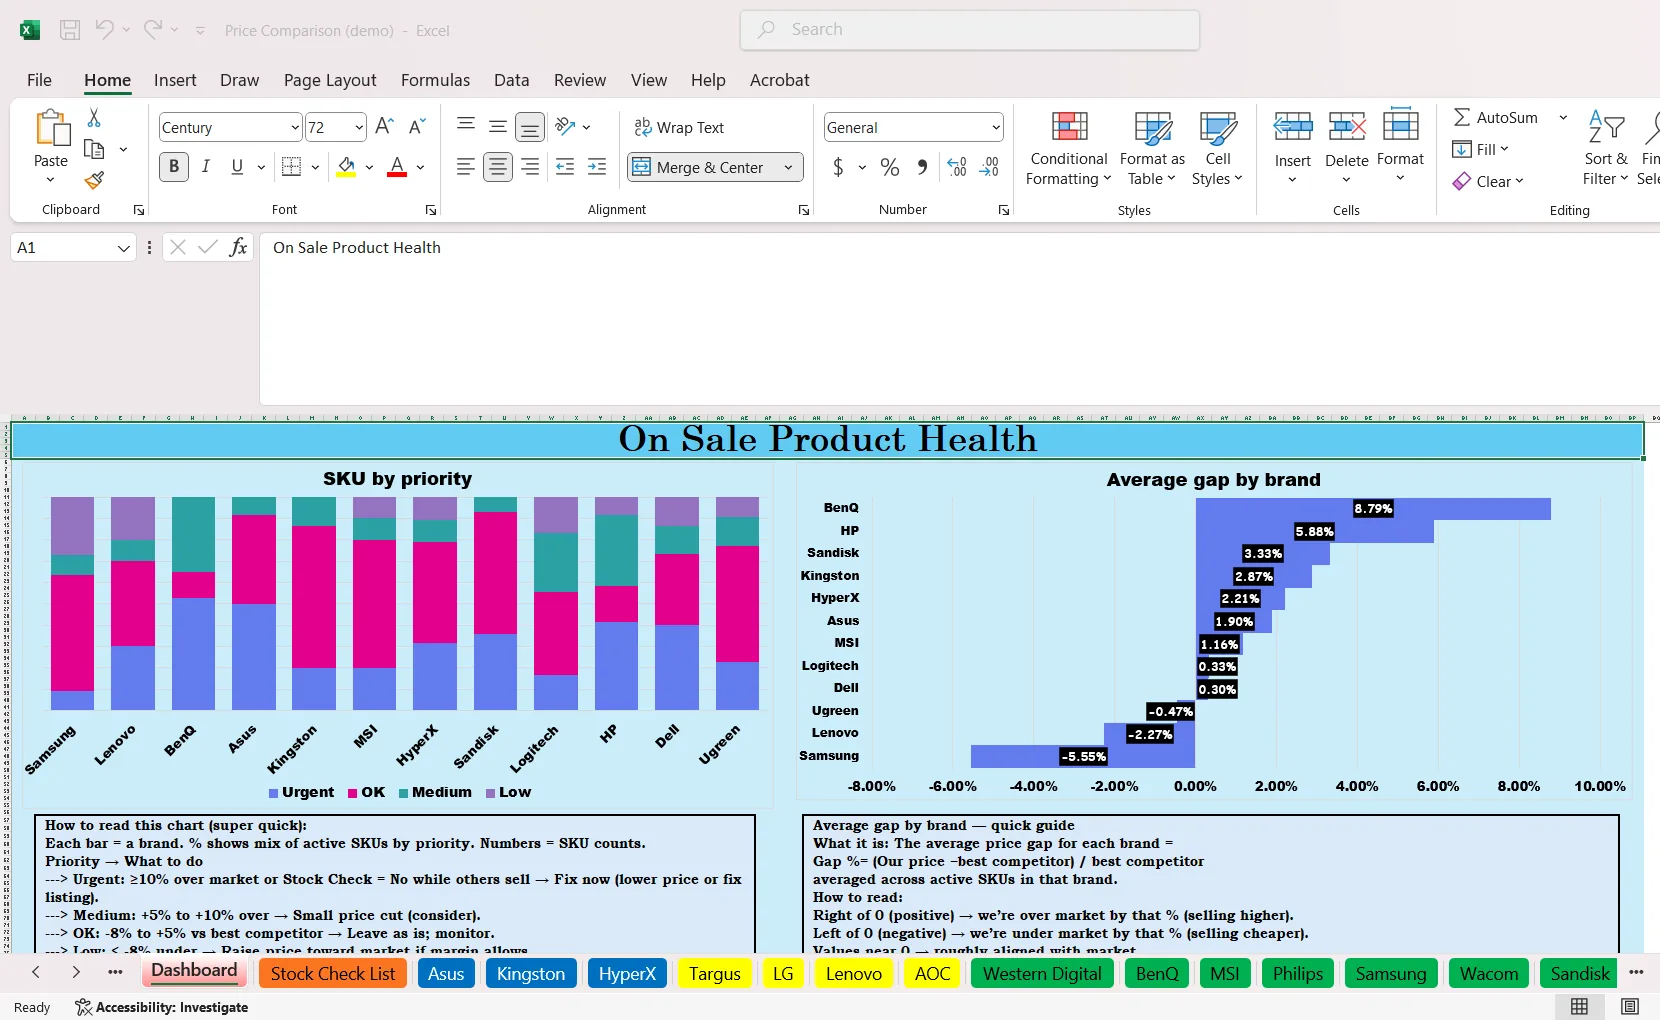
- The dashboard’s pivot tables count products by priority and stock, and show the average price gap per brand.
The rule behind the Action column, simplified:
=IFS(gap >= 10%, "Lower price now",
     gap >= 5%,  "Consider adjust",
     gap <= -8%, "Raise price",
     TRUE,       "Keep price")